Post mortem of a failed HackerNews launch
Right after our TC press post we were onto showcasing Cucumbertown to the HN community and taking feedback. Things were looking fine for sometime until Murphy decided to play spoilsport and we hit ocean bottom when we showed up on the front page.
1 hour on the HN homepage and we were out.
Pretty saddening experience. And it got me all the more pissed off for:
- The community was showing positive emotions, constructive criticism. HN community’s remarks and constructive criticism are pearls of wisdom.
- I did performance engineering at Zynga for a while. This shouldn’t have happened.
It’s somewhat interesting to understand what happened underneath and how we went on to fix it.
Here’s how the drama unfolded.
At about 8:30 AM PST I posted the news to HN and waited for someone to up vote. A bump and since it was a “Show HN”, it started moving fast and pretty soon was on its way to the front page.
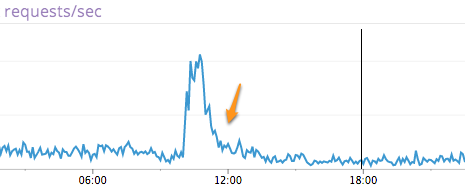
The connections started increasing and things looked pretty good.

The traffic coming in brought with it people who loved food & had so much positive emotions.
Love was in the air.

Juggling between the intense stream of answering mails from new members & questions on HN I found myself singing Backstreet Boys for an hour…
Until one of our users Trey and an HN user shot me an IM.

We started probing the graphs and it looked like the world was coming to an end.
User United857 struck the nail in the coffin with this message and we were officially down by 11:30 PM IST. It was 404 hell.

The worst part, ssh did not work anymore. All we could wait was to get the terminal buffers to allow us to type a character at a time.
Eventually we got the monit alerts.
Continuous 404’s ensured we went out of the front page and pretty soon down the drain.

Even though HN traffic is not our direct market, posting on HN, taking feedback and learning has always been my dream. And it was…
Without considering that we were pretty down & drained already and that it’s nearly 1 AM in Bangalore we decided to get to the root of this.
What became of this investigation is a lesson in carelessness. One I hope I’ll remember for sometime.
So back to the train of events…
Once the domino effect started all we could do was to wait and watch httpd & java processes fail via monit mails.
I’ll save the detailed investigation (its too verbose) and go directly to inference.
Digging through the trails later we saw that
Free memory had decreased, IO wait increased drastically & immediately after that Solr hung. Apache piled the requests and stopped responding. This led Nginx to return 404’s. This continued for 20-30 minutes as a black box.
Eventually Solr crashed releasing some memory. This helped us restart the services. But the damage was done by then.
Digging through logs one by one and eventually in dmesg the culprit showed up

So the root cause analysis narrowed down to two points. Why did free memory come down so low and why did IOWait go up so high.
Luckily for us everything was graphed and soon enough we saw that people came in directly and started searching heavily. Solr usage went very high and it started evicting. We did not anticipate this. Pretty bad!
To make matters worse the high usage with memory consumption sent the OS to swap. Even then this should have been handled. The dmesg OOM led us to the details and that’s when we realized Linode offers only a max of 512 MB swap by default. We had gone with it and since memory + swap overflowed pretty quickly the system was OOMing.
Lessons:
- Mockup high traffic scenarios & test (Although its unlikely it would have hit us to test search so much)
- Run Solr separately from your web nodes. It’s an all, in memory process (We are a lean startup and sometimes running process together is a call we have to take. Making it all separate machines is too costly)
- Run sufficient swap.
But between failures we noticed a pattern that shouldn’t have happened.
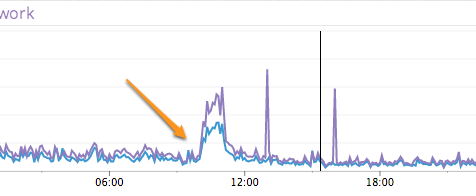
Apache requests were in sync with Nginx.

Cucumbertown is a site that’s heavily cached. Anonymous requests are all http cached at the load balancer level & only the logged in ones hit the backend web.
Digging further and we started seeing this (below). For every Nginx hit there is equivalent apache hit. But this was only for the homepage.

Since the homepage is query heavy this had a heavy impact on the underlying infrastructure. In fact you could very well conclude that the homepage hits were the reason we went down (The explore items that you see on homepage – they are all in fact a manifestation of Solr searches)

This was surprising. We had our pages cached as follows.
location = / {
 proxy_pass http://localhost:82;
 proxy_cache cache;
 proxy_cache_key $cache_key;
 proxy_cache_valid 200 302 2m;
 proxy_cache_use_stale updating;
 }
Things should have been fine. The show recipe pages were.
A curl request exposed the blunder.
Cherian-Mac: cherianthomas$ curl -I http://www.cucumbertown.com/
HTTP/1.1 200 OK
Server: ngx_openresty
Content-Type: text/html; charset=utf-8
Connection: keep-alive
Keep-Alive: timeout=60
Vary: Accept-Encoding
Vary: Cookie
Set-Cookie: csrftoken=Dl4mvy4Rky7sfZwqek27hFrCXzWCi9As; expires=Fri, 18-Oct-2013 02:15:32
 GMT; Max-Age=31449600; Path=/
X-Cache-Status: EXPIRED
I’ll leave it to the reader why X-Cache-Status always returned expired.
And now if you are like us running a machine with very little swap, create a secondary one with sufficient space and a lower priority. This will decrease your chances for OOM drastically.
Here’s how to do it.
cd /
sudo dd if=/dev/zero of=swapfile bs=1024 count=2097152
sudo mkswap swapfile
Change count accordingly
Add this to the line lower than the swap file line in /etc/fstab
/swapfile swap swap defaults 0 0
sudo swapon -a
swapon -s
Additionally add the following two lines to your /etc/sysctl.conf
vm.panic_on_oom=1 kernel.panic=15
vm.panic_on_oom=1 line enables panic on OOM;
The kernel.panic=15 line tells the kernel to reboot fifteen seconds after panicking.
In the worst-case scenario you can reboot than be hung for a longer duration
Graphs courtesy DataDog.